
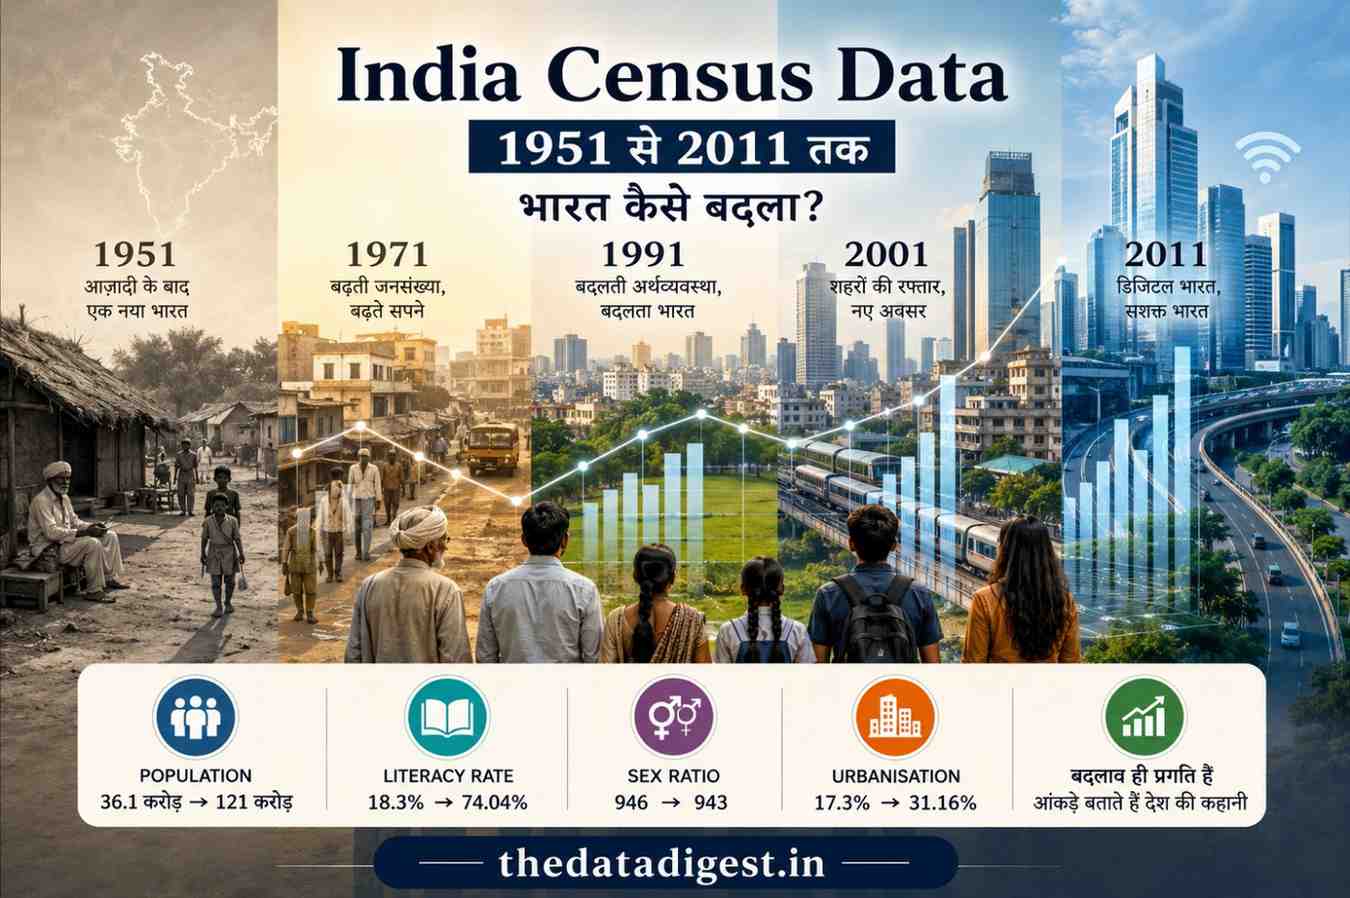
India Census Data: 1951 से 2011 तक भारत कैसे बदला?
1951 से 2011 तक Population, Literacy, Sex Ratio, Urbanisation, Population Density और भारत की demographic story को समझें — साथ ही Census 2027 की current process और key updates भी जानें।
भारत की जनगणना यानी Census केवल यह गिनने का काम नहीं है कि देश में कितने लोग रहते हैं। Census data हमें यह समझने में मदद करता है कि भारत की population कैसे बढ़ी, literacy कैसे बदली, rural और urban population का balance कैसे बदला, sex ratio में क्या बदलाव आया और population density किस तरह बढ़ी।
1951 में स्वतंत्र भारत की पहली जनगणना से लेकर 2011 की आखिरी पूरी हुई decennial population census तक भारत की demographic journey में बहुत बड़े बदलाव दिखाई देते हैं।
1951 में भारत की population लगभग 36.11 करोड़ थी। 2011 तक यह बढ़कर लगभग 121.09 करोड़ हो गई।
इसी अवधि में literacy rate लगभग 18.33% से बढ़कर 72.98% हुई और urban population का share लगभग 17.29% से बढ़कर 31.16% हो गया।
India Census Data: 1951 से 2011 तक एक नजर में
स्वतंत्र भारत की Census series को एक साथ देखने पर भारत के demographic transformation की बड़ी तस्वीर सामने आती है।
| Census Year | Population | Literacy | Sex Ratio* | Density | Urban Population |
|---|---|---|---|---|---|
| 1951 | 36.11 करोड़ | 18.33% | 946 | 117 | 17.29% |
| 1961 | 43.92 करोड़ | 28.30% | 941 | 142 | 17.97% |
| 1971 | 54.82 करोड़ | 34.45% | 930 | 177 | 19.91% |
| 1981 | 68.33 करोड़ | 43.57% | 934 | 216 | 23.31% |
| 1991 | 84.63 करोड़ | 52.21% | 927 | 274 | 25.72% |
| 2001 | 102.87 करोड़ | 64.84% | 933 | 325 | 27.81% |
| 2011 | 121.09 करोड़ | 72.98% | 943 | 382 | 31.16% |
*Sex Ratio का अर्थ है प्रति 1,000 पुरुषों पर महिलाओं की संख्या।
Historical Census figures को Census of India के published datasets और tables के संदर्भ में पढ़ना चाहिए। Census of India के official portal पर historical Census material, Census tables और अन्य resources उपलब्ध हैं।
1. Population: 1951 से 2011 तक भारत कितना बड़ा हुआ?
1951 में भारत की population लगभग 36.11 करोड़ थी। इसके बाद लगभग हर दशक में population में बड़ी वृद्धि हुई।
1951 से 2011 के बीच भारत की population तीन गुने से भी अधिक हो गई।
लेकिन केवल final numbers देखना पूरी कहानी नहीं बताता। Population growth अलग-अलग दशकों में अलग गति से हुई। Demographic transition, mortality में गिरावट, healthcare में improvement, fertility patterns और socio-economic changes जैसे कई factors population growth को प्रभावित करते हैं।
2. 1951 से 2011: Literacy में सबसे बड़ा बदलाव
India Census Data की सबसे स्पष्ट long-term stories में से एक literacy की है।
1951 में भारत की literacy rate लगभग 18.33% थी। 2011 में यह बढ़कर 72.98% हो गई।
| Census Year | Literacy Rate |
|---|---|
| 1951 | 18.33% |
| 1961 | 28.30% |
| 1971 | 34.45% |
| 1981 | 43.57% |
| 1991 | 52.21% |
| 2001 | 64.84% |
| 2011 | 72.98% |
यह लगभग 60 वर्षों में literacy के scale में बहुत बड़ा बदलाव दिखाता है। लेकिन literacy rate को education system की पूरी picture नहीं मानना चाहिए।
Census में age, sex और rural/urban residence के अनुसार education-related information भी उपलब्ध है।
किसी व्यक्ति का literate होना और उसका higher secondary या graduate level तक पढ़ा होना एक ही बात नहीं है। इसलिए Census data को केवल literacy percentage तक सीमित करके देखना उचित नहीं है।
3. Sex Ratio: भारत की कहानी सीधी रेखा जैसी नहीं रही
Sex ratio का अर्थ है प्रति 1,000 पुरुषों पर महिलाओं की संख्या।
| Census Year | Sex Ratio |
|---|---|
| 1951 | 946 |
| 1961 | 941 |
| 1971 | 930 |
| 1981 | 934 |
| 1991 | 927 |
| 2001 | 933 |
| 2011 | 943 |
1951 से 1991 तक overall decline दिखाई देता है। 1991 में sex ratio 927 तक पहुंचा। इसके बाद 2001 में 933 और 2011 में 943 तक improvement दिखाई दी।
4. Urbanisation: क्या भारत धीरे-धीरे ज्यादा urban हुआ?
1951 में India की लगभग 17.29% population urban areas में रहती थी। 2011 तक यह share बढ़कर 31.16% हो गया।
| Census Year | Urban Population Share |
|---|---|
| 1951 | 17.29% |
| 1961 | 17.97% |
| 1971 | 19.91% |
| 1981 | 23.31% |
| 1991 | 25.72% |
| 2001 | 27.81% |
| 2011 | 31.16% |
Urbanisation को समझने के लिए migration, town growth, urban classification और changing settlement patterns जैसे factors को भी देखना पड़ता है।
Urban population बढ़ने के साथ housing, roads, public transport, water supply, sanitation, healthcare, schools और employment infrastructure जैसी planning needs भी महत्वपूर्ण होती हैं।
5. Population Density: एक ही जमीन पर ज्यादा population
Population density का अर्थ है प्रति square kilometre कितने लोग रहते हैं।
| Census Year | Population Density |
|---|---|
| 1951 | 117 |
| 1961 | 142 |
| 1971 | 177 |
| 1981 | 216 |
| 1991 | 274 |
| 2001 | 325 |
| 2011 | 382 |
1951 में density लगभग 117 persons per sq. km. थी। 2011 में यह बढ़कर 382 persons per sq. km. हो गई।
लेकिन national average पूरी तस्वीर नहीं बताता। भारत के अलग-अलग states और districts में population density में बहुत बड़ा अंतर है।
6. Age Structure: Population की उम्र भी महत्वपूर्ण है
Population की total संख्या के साथ उसका age structure भी बहुत महत्वपूर्ण है।
2011 Census में अलग-अलग age groups के अनुसार male और female population का detailed data उपलब्ध है। National level पर broad age groups को देखें तो 0–14 वर्ष की population 29.5%, 15–59 वर्ष की 62.5% और 60+ वर्ष की population 8.0% थी। ये figures age structure को केवल concept की तरह नहीं, बल्कि measurable demographic indicator की तरह समझने में मदद करते हैं।
| Broad Age Group | 2011 में Population Share | Demographic Meaning |
|---|---|---|
| 0–14 years | 29.5% | Children and young population |
| 15–59 years | 62.5% | Working-age dominated group |
| 60+ years | 8.0% | Elderly population |
ये broad age-group figures India के 2011 age-composition data से लिए गए हैं। अलग tables में age-group definitions अलग हो सकती हैं, इसलिए किसी specific age group की तुलना करते समय table definition जरूर देखें।
अगर बच्चों की population ज्यादा है
Schools, teachers, child healthcare, nutrition और education infrastructure की future demand को समझना जरूरी हो जाता है।
अगर working-age population बड़ी है
Jobs, skills, higher education और economic opportunities का महत्व बढ़ जाता है।
अगर elderly population बढ़ती है
Healthcare, pensions, social security और elderly care की जरूरत ज्यादा महत्वपूर्ण हो सकती है।
इसलिए क्या समझें?
Population size और age structure को साथ पढ़ना demographic analysis को ज्यादा meaningful बनाता है।
7. Census और Education: Literacy से आगे की कहानी
Census data हमें केवल literacy percentage नहीं देता। Educational level के अनुसार भी information उपलब्ध होती है।
2011 Census में education-related tables में age, sex और rural/urban characteristics के अनुसार educational information उपलब्ध है। National literacy rate 72.98% थी; male literacy 80.88% और female literacy 64.63% थी।
| Indicator | Census 2011 |
|---|---|
| Overall Literacy | 72.98% |
| Male Literacy | 80.88% |
| Female Literacy | 64.63% |
Literacy ≠ Complete Education Profile
Literacy यह बताती है कि व्यक्ति basic literacy criteria को meet करता है या नहीं। इससे आगे educational attainment को अलग से देखना पड़ता है।
8. Census और Workers: Population का Economic Side
Census data में workers और work status से संबंधित information भी record की जाती है।
Census 2011 के अनुसार India में लगभग 48.17 करोड़ workers थे और overall Work Participation Rate (WPR) 39.8% थी। Rural areas में WPR 41.8% और urban areas में 35.3% दर्ज की गई थी।
| Residence | Total Population | Number of Workers | WPR |
|---|---|---|---|
| Total | 1,210,569,573 | 481,743,311 | 39.8% |
| Rural | 833,463,448 | 348,597,535 | 41.8% |
| Urban | 377,106,125 | 133,145,776 | 35.3% |
यह information researchers और policymakers को population और livelihood patterns समझने में मदद कर सकती है।
9. Household और Housing Data क्यों महत्वपूर्ण हैं?
Census केवल individuals की counting तक सीमित नहीं है। Households और housing characteristics भी Census की महत्वपूर्ण components हैं।
इससे housing planning, water supply, sanitation, electricity, household amenities और urban planning जैसे areas में analysis के लिए useful information मिलती है। Census 2011 के official population release के अनुसार India में लगभग 24.95 करोड़ households दर्ज किए गए थे।
India में Census 2011 के अनुसार 24.95 करोड़ households थे। यह household count individual population count से अलग indicator है और housing तथा household-level planning को समझने में उपयोगी है।
10. 1951 से 2011 तक भारत की सबसे बड़ी Demographic Trends
Population Growth
36.11 करोड़ → 121.09 करोड़
भारत की population तीन गुने से अधिक हुई।
Literacy
18.33% → 72.98%
Literacy में बड़ा long-term improvement हुआ।
Urbanisation
17.29% → 31.16%
Urban population का share काफी बढ़ा।
Population Density
117 → 382
प्रति square kilometre population density में बड़ा increase हुआ।
Sex ratio का trend linear नहीं था। 1951 के 946 से 1991 में 927 तक decline के बाद 2011 में यह 943 तक पहुंचा।
11. 1951 vs 2011: भारत में कितना बदलाव आया?
| Indicator | 1951 | 2011 |
|---|---|---|
| Population | 36.11 करोड़ | 121.09 करोड़ |
| Literacy Rate | 18.33% | 72.98% |
| Sex Ratio | 946 | 943 |
| Urban Population Share | 17.29% | 31.16% |
| Population Density | 117 | 382 |
12. Census Data को सही तरीके से कैसे पढ़ें?
Census data पढ़ते समय चार basic questions पूछना useful है।
कितना बदलाव हुआ?
Absolute change कितना है?
कितनी तेजी से?
Decade-wise growth कैसी रही?
कहाँ बदलाव हुआ?
State, district, rural और urban areas में pattern क्या है?
इसका मतलब क्या है?
क्या connection literacy, age structure, urbanisation, migration या workforce से है?
13. National Average पूरी कहानी क्यों नहीं बताता?
मान लीजिए India की literacy rate 72.98% है। इसका अर्थ यह नहीं है कि हर state में literacy exactly 72.98% है।
इसी तरह national sex ratio 943 होने का अर्थ यह नहीं है कि हर district में sex ratio 943 है।
इसलिए serious Census analysis में:
का comparison ज्यादा useful होता है।
14. 2011 Census Data आज भी इतना महत्वपूर्ण क्यों है?
2011 के data को आज भी पढ़ने का मुख्य कारण यह है कि 2011 के बाद अगली decennial Population Census के final results अभी उपलब्ध नहीं हैं।
अब अगला major Census exercise Census 2027 है।
Phase I
Houselisting & Housing Census
2026 में states/UTs के schedule के अनुसार।
Phase II
Population Enumeration
अधिकांश देश के लिए February 2027 में scheduled।
15. Census 2027 भारत की Demographic Story में अगला Chapter क्यों है?
Census 2027 में technology का role पहले की तुलना में बहुत अधिक है। Government ने Census 2027 को India’s first digital Census/first digital enumeration exercise के रूप में describe किया है।
Digital/mobile systems और Self-Enumeration जैसी facilities Census process का हिस्सा हैं। Government के अनुसार Census 2027 में digital tools और mobile-based data collection का उपयोग किया जा रहा है, जबकि traditional door-to-door enumeration भी process का हिस्सा बना हुआ है।
12 August 2026 की Ministry of Home Affairs/PIB update के अनुसार Phase I यानी Houselisting and Housing Census 31 States/UTs में complete हो चुका था और remaining areas में इसे September 2026 तक पूरा करने का schedule था।
Phase II यानी Population Enumeration अधिकांश देश में February 2027 में scheduled है। Ladakh तथा Jammu & Kashmir, Himachal Pradesh और Uttarakhand के snow-bound non-synchronous areas में Phase II 1–30 September 2026 और revisional round 1–5 October 2026 के लिए notified है।
14 August 2026 को Population Enumeration में पूछे जाने वाले questions की notification जारी की जा चुकी है। Census 2027 के second phase में caste enumeration भी शामिल है।
Digital Census का अर्थ केवल online form भरना नहीं है। Digital systems data collection, monitoring, processing और management के अलग-अलग stages में इस्तेमाल किए जा रहे हैं।
Census 2027 के final results आने के बाद ही यह पता चलेगा कि 2011 के बाद India के demographic indicators में कितना बदलाव हुआ। Data Digest पर Digital Census 2027 और Census 2027 Household Schedule से जुड़ी अलग-अलग explainers भी उपलब्ध हैं।
16. 2011 और 2027 को Compare करने पर क्या पता चल सकता है?
Population
Population growth कितनी रही?
Literacy
Education profile किस दिशा में बदली?
Sex Ratio
Gender balance में क्या बदलाव आया?
Urbanisation
Urban population का share कितना बढ़ा?
Age Structure
India की population younger हुई या older?
Migration
Migration patterns में क्या बदलाव दिखाई देता है?
17. Census Data से Government Planning कैसे जुड़ती है?
Census data government planning के broader statistical ecosystem का एक महत्वपूर्ण input है।
18. Census Data Students और General Readers के लिए क्यों Useful है?
🎓 Competitive Exams
Population, literacy, sex ratio और Census history से जुड़े questions के लिए।
📚 Students
Geography, economics, sociology और population studies के लिए।
📊 Researchers
Demographic trends और regional differences के analysis के लिए।
🏙️ General Readers
अपने state, district और देश में population changes समझने के लिए।
19. Census Data की Limitations भी समझें
इसलिए annual population change के लिए Census अकेला source नहीं है।
India का average किसी state या district की exact स्थिति नहीं बताता।
2011 Census historical baseline है। Current employment, migration, health या economic conditions समझने के लिए relevant latest surveys और administrative datasets भी देखने चाहिए।
20. India Census Data: पूरी कहानी एक नजर में
Population
36.11 Cr → 121.09 Cr
Literacy
18.33% → 72.98%
Urban Share
17.29% → 31.16%
Density
117 → 382
लेकिन सबसे महत्वपूर्ण बात केवल ये numbers नहीं हैं। इन numbers के पीछे भारत की बदलती population structure, education profile, urbanisation, household patterns, workforce और regional distribution की कहानी है।
21. Census 2027: भारत की कहानी का अगला Chapter
1951 से 2011 तक की Census journey भारत के demographic transformation का एक लंबा statistical record है।
अब Census 2027 इस journey का अगला महत्वपूर्ण chapter बनने जा रहा है।
Population Enumeration February 2027 में scheduled है और Census 2027 में demographic, socio-economic, education, migration और fertility related information collect की जाएगी। Caste enumeration भी second phase में शामिल की गई है।
जब Census 2027 के final results उपलब्ध होंगे, तब researchers के पास भारत की demographic transformation को और लंबे historical perspective से समझने का अवसर होगा।
Frequently Asked Questions (FAQs)
India Census Data क्या है?
India Census Data भारत की population और उससे संबंधित demographic, social, economic तथा housing characteristics का official statistical data है।
स्वतंत्र भारत की पहली Census कब हुई?
स्वतंत्र भारत की पहली Census 1951 में हुई थी।
1951 में भारत की population कितनी थी?
1951 Census के अनुसार India की population लगभग 36.11 करोड़ थी।
2011 में भारत की population कितनी थी?
2011 Census के अनुसार India की population लगभग 121.09 करोड़ थी।
1951 में India की literacy rate कितनी थी?
1951 में literacy rate लगभग 18.33% थी।
2011 में India की literacy rate कितनी थी?
2011 Census में literacy rate लगभग 72.98% थी।
2011 में India का sex ratio कितना था?
2011 Census के अनुसार sex ratio 943 females per 1,000 males था।
2011 में India की urban population कितनी थी?
2011 में लगभग 31.16% population urban areas में रहती थी।
2011 में India की population density कितनी थी?
2011 Census के अनुसार India की population density 382 persons per square kilometre थी।
Census 2027 कब होगा?
Census 2027 दो phases में conduct किया जा रहा है। Houselisting & Housing Census का Phase I 2026 में और Population Enumeration का Phase II अधिकांश देश में February 2027 में scheduled है।
क्या Census 2027 digital होगा?
हाँ। Census 2027 में digital/mobile systems और Self-Enumeration जैसी facilities को process में शामिल किया गया है।
क्या Census 2027 में caste enumeration होगी?
Government के निर्णय के अनुसार Census 2027 के second phase यानी Population Enumeration में caste enumeration की जाएगी।
Official Sources & Further Reading
- Census of India — Official Portal — Historical Census resources, Census tables, Population Finder और official Census information.
- Census Tables — Government of India — Census tables और datasets.
- Population Finder — Census of India — State, district और lower administrative levels पर Census data.
- Press Information Bureau — Government of India — Census 2027 से संबंधित official government updates.
- Census 2027 Preparatory Activities — PIB, 12 August 2026 — Phase I status और Phase II के notified special-area schedule की जानकारी.
- Census 2027 Second Phase Questions — PIB, 14 August 2026 — Population Enumeration के questions की notification.
Data Digest से जुड़े रहें
Government information, technology, career updates, competitive exam resources और useful digital tools के लिए Data Digest को follow करें।
Data Digest किसी government ministry, department, commission, board, recruitment agency या अन्य सरकारी संस्था से affiliated नहीं है। किसी भी महत्वपूर्ण सरकारी प्रक्रिया, deadline या official information के लिए संबंधित सरकारी portal पर latest information जरूर verify करें।
Read Full Disclaimer | Privacy Policy | Contact Us